How Do You Know Your Google Ads Are Working?
Over on Multifamily Insiders, Beth asked a great question about her Google Ads:
How do you know what you’re spending on Google Adwords is working? I’ve been asked by our owners to create a report that justifies our spending towards Google Adwords and not sure if there is a direct way to verify traffic or lease to Google Adwords. This might be a question for the marketing team, but just curious how your company verifies the cost of Google Adwords and its value is validated.
This is such a great question. (Thanks, Beth!)
The short answer is this: You want to tie your ad results as precisely as you can to real business results – what did you spend, what did they get out of that investment, and what could you do better next time?. And with Google Ads, those results should come relatively quickly – a smart, targeted campaign should almost immediately produce an increase in phone calls, email leads, and tours.
Focus primarily on those lead generation metrics, but also understand that those numbers alone won’t tell the full story of how Google Ads might be contributing to your leasing success.
To provide a better answer to the question (backed up by data), you’ll want to have access to the followIng:
- Your Google Ads account [ads.google.com]
- The Google Analytics account for your website [analytics.google.com]
- Your Google My Business account [google.com/business]
- Your call tracking reports
- Your lead management/CRM reports
Here are some specific things you can measure to show the effectiveness of your Google Ads (ordered in the typical order they occur along the customer journey, not in order of importance to your business results):
- Total Impressions
- Clicks to Website / Click-Through Rate (CTR)
- Website Visits from Cost-Per-Click (CPC)
- Leads from CPC (Website Conversions)
- Assisted Conversions from CPC
- Direct Phone Calls from Ads
- People Requesting Directions to Your Location
- Cost Per Lead
- Leases Where CPC Contributed
Now that we know what to look for let’s dig into why these metrics matter and where you can find them.
Total Impressions
Before anyone gets to your site, they need to see you in the search results. Every time your ad shows up at the top of a search and someone sees it, that’s an impression. Impressions don’t make you money directly, but they’re a leading indicator to help you see that you’re getting your brand in front of more potential prospects.
The number of impressions will vary depending on how much you’re spending and the type of keywords you’re targeting with your campaigns, but generally, you want to see a significant number here to make sure you’re giving yourself as many opportunities as possible.
You’ll find this number in your Google Ads and Google Analytics dashboards.
Clicks to Website / Click-Through Rate (CTR)
Now that we know people see your ads, you want to see that your ads are compelling people to check you out. For most Google Ads campaigns, this will be a click through to your landing page. (Yes, you want to be using landing pages that match the subject of the ad and are built to increase conversions. Stop sending that traffic to your homepage.)
Your total clicks will vary depending on your spend, your bid strategy, and the strength of your ad copy. You want to see a higher number of clicks and a higher click-through rate (assuming those clicks are leading to conversions, which I’ll describe later). CTR can vary widely — I’ve seen ads get click-through rates under 2%, and I’ve seen “defensive” branded ads get CTRs of 20-30% or higher. There is no “benchmark” here because every campaign is different and will see different results.
Consider Your Top Keywords and Highest Performing Ads
To improve your ads going forward, you want to understand which headlines are working, as well as the phrases people are searching for to get to you (called Keywords). Test a few different variations on your headlines to get a better idea of what shoppers respond to most.
When you know which keywords are generating the most traffic, this helps you in two ways. One, you can focus your ads on those keyword phrases that are working for you, and you can even adjust your budgets to put more of your spend toward those phrases. Two, these are probably terms where you should be investing more in smart content on your site. If you have more relevant content on your site that is the best answer for that particular search term, you’ll start to rank higher organically for that phrase … which means you’ll see more traffic from SEO that will ultimately reduce the need to buy that traffic through paid ads.
You can find Clicks, CTR, and Keywords in your Google Ads and Google Analytics reports.
Website Visits from Cost-Per-Click (CPC)
This one is similar to Clicks. This is the total number of website visits (called Sessions in Google Analytics) that are coming from your ads. (If this number isn’t really close to your Clicks total, you might want to check two things: 1) Is your website loading slowly, especially on mobile? and 2) Is your Google Analytics code properly installed on every page on your site?)
In Google Analytics, you may also want to look at your Sessions from CPC as a percentage of your total traffic. (Ex: “We spent $1,500 on our Google ads last month, resulting in 1,400 sessions, representing 32% of our total website traffic for the month.”)
A complementary metric to look at here is Time on Site (called Session Duration in Google Analytics). If you’re getting traffic to your site, but you do not see many of those visits convert to leads, you may want to check this number. If people aren’t spending much time (typically 30-60 seconds or less) on your site, it might be the landing page that is the issue, not the ads themselves. Session Duration is a good indicator of whether your site is providing relevant, quality information to the people coming in from a given source.
You’ll find Sessions from CPC and Session Duration under Acquisition > All Traffic > Source/Medium in your Google Analytics.
Leads from CPC (Website Conversions)
In my experience, this one is the single most important metric when it comes to reporting your successes. The multifamily business runs on turning leads into leases; the whole purpose of any advertising source is to help you generate those leads. To know if your Google Ads are working, you have to be able to see how many leads you’re getting from your Google Ads.
This part isn’t set up for you out of the box, so you’ll need to work with your PPC vendor and your website provider to get this right. (You may need to recruit your lead management provider and whoever provides your call tracking numbers, too.). In online advertising lingo, leads fall under a metric called Goal Conversions.
Every opportunity for someone to contact you is a potential Conversion you’ll want to track. Here are some possible Conversions you may have on your site:
- Contact forms (Guest cards) — How many prospects filled out a contact form asking for more information?
- Phone calls (Dynamic tracking numbers, also called DNI) — How many people called from your website after clicking through from an ad? And taking it a step further, how many of those calls actually converted to leads? (You’ll want to know what a good phone lead looks like … this isn’t useful if you’re getting a bunch of hang-ups, or if the customer has to go through some long automated system just to get to a real person.)
- Leads submitted through live chat or chatbot — How many prospects initiated a chat session that successfully resulted in a scheduled tour or lead capture?
- Lead capture pop-ups — How many prospects filled out your email pop-up to redeem an offer or request more info?
- Tour scheduler — How many prospects used your tour scheduler to book an appointment to see the property?
Once you have all of your lead capture points set up as Goal Conversions in Google Analytics, you’ll be able to see how many of each type of lead you’re getting and which ad sources are driving those leads (including your Google Ads.). You’ll also be able to see your website’s overall Conversion Rate — if your website is a leasing agent, think of the Conversion Rate like its Closing Ratio.
Once this is set up, here’s what that report will look like in Analytics:
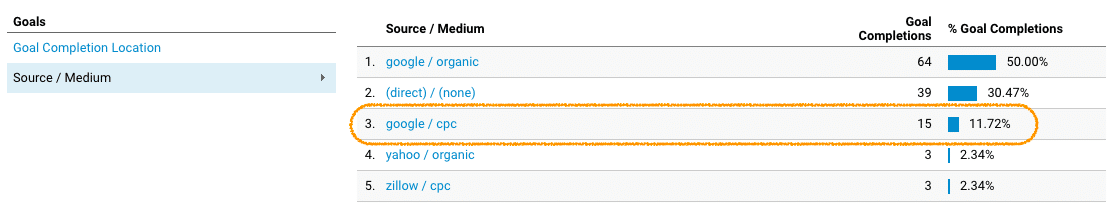
When expressed as a percentage of your total traffic, your Conversion Rate may feel like a low number (sometimes it might be only 2-3%), but focus on the total number of leads you’re collecting. Are you getting enough qualified leads coming through to keep your leasing pipeline full? That’s really the number to focus on here.
That said, work with your PPC vendor and website provider to improve that Conversion Rate — the more you can do to get a higher percentage of website visitors converting into qualified leads, the less you’ll ultimately need to spend on ads to attract those visitors.
In other words: Close more, spend less.
You’ll find your Goal Conversions under the Conversions tab in your Google Analytics reports.
The better you close, the less you need to spend on advertising.
Assisted Conversions from CPC
Not every prospect clicking through from an ad is ready to contact you right away. They may leave your site to go check out reviews, ask friends on social, or start another search. But just because they didn’t convert to a lead the first time they click through, that doesn’t mean the ad didn’t work. That’s why we also want to track something called Assisted Conversions (and its sister report, Top Conversion Paths).
Here’s an example of an Assisted Conversion:
The prospect clicks on your ad and visits your website, but leaves without contacting you. Then two days later, they do a search for your property name, click the organic link in the search results, and book an appointment to tour the property. If you only look at the main Conversion Sources report in Analytics, this would show up as a lead from Organic Search. But if you look at the Assisted Conversions report, you’ll see the actual behavior flow: CPC > Organic > Lead.
Why does this matter?
Because the Google Ads contributed here. That’s where the prospect initially found you, so it should get some credit toward that lead. (In Marketing Attribution modeling, the First Touch model would credit the lead to the PPC ad. Last Touch would give all the credit to the property website. A Linear model would give the PPC ad, organic SEO, and the property website all equal credit.) If you’re not considering Assisted Conversions, you’re not illustrating the full impact of your Google Ads on your lead generation efforts.
In this screenshot, you can see that Paid Search contributed to five leads over this time period, even though the credit for those leads would typically go to the Property Website or Organic Search as the “referring source.”

Assisted Conversions are in the Conversions section (Conversions > Multi-Channel Funnels > Assisted Conversions) of Google Analytics.
Direct Phone Calls from Ads
This one may not apply to everyone, depending on how your campaigns are set up. But if you’re running ads on mobile, there’s a good chance you’re running “Click to Call” ads where the initial action is a phone call to your property, not a click through to your website.
Google layers their own tracking numbers on top of whatever number you provide here, so you’ll see Calls in your Google Ads reports, and if you’re using a call tracking number on the backend, you’ll see this number reported there, too. The Google Ads reports will also be able to give you a Cost-Per-Call number here.
People Requesting Directions to Your Location
Most people still want to physically see the property and the apartment, so getting people to the property should be a critical metric worth tracking.
Everyone (seriously, everyone) should have their free Google My Business (GMB) listing claimed for their property. Your PPC vendor can work with you to connect your GMB listing to your Google Ads. Once that’s done, you can display your address in some of your ads, and you can have your ads show up as promoted locations on Google Maps.
This one isn’t perfect (it’s not a direct measurement of leads generated from Google My Business), but it will give you some sense of how many people looking at you online want to take that next step to come see you in person.
If your campaigns are set up for this, you’ll find this data in your Google Ads account. Google My Business will also tell you how many people are requesting directions to your address (across all sources, not just from Ads).
Cost Per Lead
Once you know your spend and the total number of leads that came from that source, you’ll be able to calculate your total cost per lead for your Google Ads. This is an easy one, but don’t forget to include any ad management fees you’re paying (if you’re using a PPC vendor or some software to help manage your campaigns) – you want to understand the full cost you’re paying for those leads coming from your paid search campaigns.
If you’re happy with your overall cost per lead, and you see that those leads are qualified and converting to leases at a high rate, then keep investing.
NOTE: Something essential to keep in mind here … Marketing reports will often report different data than Operations reports. In many cases, the Operations software systems aren’t able to report on contributing sources. They only report the last touch, which is often the property website where the prospect filled out the contact form. If you see that your Operations reports are overreporting leads from the property website (and therefore underreporting leads from ads, SEO, social, and all the other sources driving traffic to your site), you may need to run a comparison to your Google Analytics and other marketing reports to get a better picture of which advertising channels are actually producing results for you.
Leases Where CPC Contributed
This one is the money maker, but in most current lead management systems, it’s going to take a bit of work to piece together. You might need to do it through lease matching, or you may have another method to connect your leases back to leads you’ve received.
Keep in mind, most renters are looking at many different resources throughout their search (go back to those Assisted Conversions), so it’s not wise to try to attribute a given lease to a single source.
Instead, try to understand all of the sources that contributed to that lease, and seek to understand the sources (and customer paths) that tend to contribute most often and most cost-effectively. Those are the sources where you should continue to invest your ad dollars.
Google is where most people tend to start their apartment search. It’s where people go when they’re researching, when they’re in buying mode, and when they’re ready to come see you. Once you start running ads, you’ll increase your chances of showing up in those results almost immediately. With a smart strategy, you should see an increase in phone calls, email leads, and tours within days, if not hours.
Used effectively, Google Ads can be an outstanding way to reach your target audience and drive quality traffic to your website and your property. The budget is entirely flexible, so don’t be afraid to test things out – dial your spend and bidding up and down as necessary until you find a program that works for your business.
And when you’re asked to report on the success of your ads, arm yourself with these metrics to provide a data-backed answer that shows how your decisions are driving revenue and business success in a very cost-effective way. Tailor your audience to focus on what matters to the person receiving the report. You may reorder things and present a report like this:
- Leases Where CPC Contributed
- Leads from CPC (Website Conversions)
- Total Ad Spend and Cost Per Lead
- Assisted Conversions from CPC
- Direct Phone Calls from Ads
- People Requesting Directions to Your Location
- Website Visits from Cost-Per-Click (CPC)
- Clicks to Website and Click-Through Rate (CTR)
- Total Impressions from Google Ads
That’s it; you’re now ready to show how your ads are performing … and you’re probably more prepared to assess your campaigns and identify areas where you can make some improvements going forward, too.
Have other questions you’d like to have answered about Google Ads or anything else across your digital marketing efforts? Reach out anytime; that’s why we’re here. Best of luck with those campaigns, and happy leasing!