Building an Apartment Website That Converts: What to Measure
This is part two of our series on improving conversions on your apartment website. Here’s where you can read the first article in the series — 5 Things to Do Today to Improve Conversions on Your Apartment Website.
“In God we trust; all others must bring data.”
There are two ways to squeeze more leads out of your apartment marketing:
- Drive more traffic, through tactics like buying more ads, adding new ad sources, posting more to Craigslist, or increasing referral bonuses, or
- Convert more of the traffic you’re already getting in the door.
Think about your leasing office for a moment. You probably already measure the closing rate for your leasing staff. You might track how many tours they get to sign, and you may use tools like mystery shops to measure their performance and look for ways to help them improve their sales skills.
But are you doing the same for your online leasing office — your property website?
Are you looking at your website’s closing rate? Are you implementing ways to make your website better at closing, or even just better at getting visitors to take the next step and contact the property?
You absolutely should be.
The good news is that it’s not that difficult to track … as long as you know what to look for and have the right tools in place to surface the data you need to make more informed marketing decisions.
NOTE: Don’t forget to grab our FREE Conversion Tracking Dashboard for Google Analytics at the end of this post.
Today, we want to go over the key stats that help you get a better picture of how your website is performing. All of the metrics we’ll cover can be measured in Google Analytics, which is our tracking tool of choice for most websites. (We’ll look at more tools to help you improve your conversions in the third part of this series.)
These aren’t just numbers we’re pulling to satisfy some weekly report. These metrics will help you answer key questions about the health of your marketing efforts:
- How are we doing? Is what we’re doing working?
- Are we investing our ad/marketing dollars in the right places?
- Are we improving?
- When did visitors take action on our site?
- And most importantly, why did it happen?
I’ll give you an easy way to track these metrics at the end of the post … so keep reading. 🙂
First, if you want to see that you’re getting more lead conversions from your website, you need to be able to identify when visitors are taking the desired actions on your site … which means no conversion marketing analysis is complete without tracking your Conversion Rate.
To Improve Conversions, Measure Conversions
Not everyone who visits your website is going to be ready to buy, so you need to have something to offer for prospects at each stage of the leasing process — LOOK > LEARN > LEASE.
The more you think about ways to connect with prospects in each stage, the easier you’ll make it for them to contact you to take the next step in the process … and move one step closer to doing business with you over anyone else.
These “hooks” you offer to entice people to take action are your conversion points. The percentage of your website visitors who take action is your Conversion Rate. The more effective your hooks, the higher your conversion rate and the more leads you’ll collect … without spending any more money on buying more traffic.
(Total Conversions / Total Sessions) * 100 =
Conversion Rate
Pull up your website in a new tab.
Take a look around … what are the primary actions you want the visitor to take that will help them get closer to leasing with you? Here’s a sample of some conversions you might start with —
Types of Conversions to Track:
- Guest cards (contact forms) completed (Note: Take any visible email addresses off of your website, or else you’ll risk reducing your measurable conversions from your site.)
- Phone leads
- Applications started
- Applications completed
- Coupons downloaded
- Appointments scheduled
- New email/blog list subscriptions
- Time spent on site or on specific pages (Especially useful to see if people are watching your videos)
- On-page events, such as social shares
When set up properly, Google Analytics can track all of these for you (and more). But keep in mind, each website is different, and the way the visitor takes action to successfully convert will vary.
This is important to keep in mind, because getting to your conversion rate isn’t something that is configured “out of the box” with Google Analytics. Work with your marketing team and your web developer to look at the conversion points you want to measure, then set up Conversion Goals that allow you to track this.
Trust me, it’s worth it … without this in place, you’re basically driving blind.
Here’s the beautiful part: Not only will you be able to see if your message is getting people to take action, but you’ll also be able to see which marketing channels are driving the most conversions through your site. There could be a huge difference between the sites that drive a lot of traffic to your site and the sources that deliver leads most effectively … and you can’t see that difference if you’re not tracking Conversion Goals.
There could be a huge difference between your top traffic sources and the channels that convert leads most effectively.
(Side note: We’ve seen that some website templates provided by property management software companies aren’t set up to accommodate proper Conversion Goal tracking. If your property website is provided by your PMS, ask them about the best way to get this tracking set up in your Analytics platform. There are some workarounds for this … but make sure you have access to an analytics expert to avoid messing up your data!)
Overall Traffic by Source
While Conversion Rate is the “bottom line” number that helps you understand how your website is performing, there are a number of other data points that you’ll want to keep an eye on.
One of the biggest is how much traffic (called Sessions in Analytics) you’re getting to your site. You can break this down further by looking at your traffic by source (Acquisition > All Traffic > Source/Medium). This is an easy way to see if you’re getting the traffic you need to keep your lead pipeline full, and which individual sources are contributing to the effort most.
Bounce Rate: Know When Pages Aren’t Working
The last thing you want when a visitor gets to your website is for them to leave without taking the time to see what you have to offer. If a visitor leaves your site after only visiting one page, this is called a bounce; the total percentage of visitors who bounce is called the Bounce Rate.
One caveat here: You shouldn’t be too concerned with the overall bounce rate of your site. While this is something you can eventually focus on, you want to start with your bounce rate for your key sales pages — these are the pages that matter most.
Start with your top landing pages, your photo & video galleries, your floor plan pages, etc. If visitors are bouncing off these pages, there’s no question you’re losing leads … and you need to do some digging to see what steps you can take to get more prospects converting from these pages.
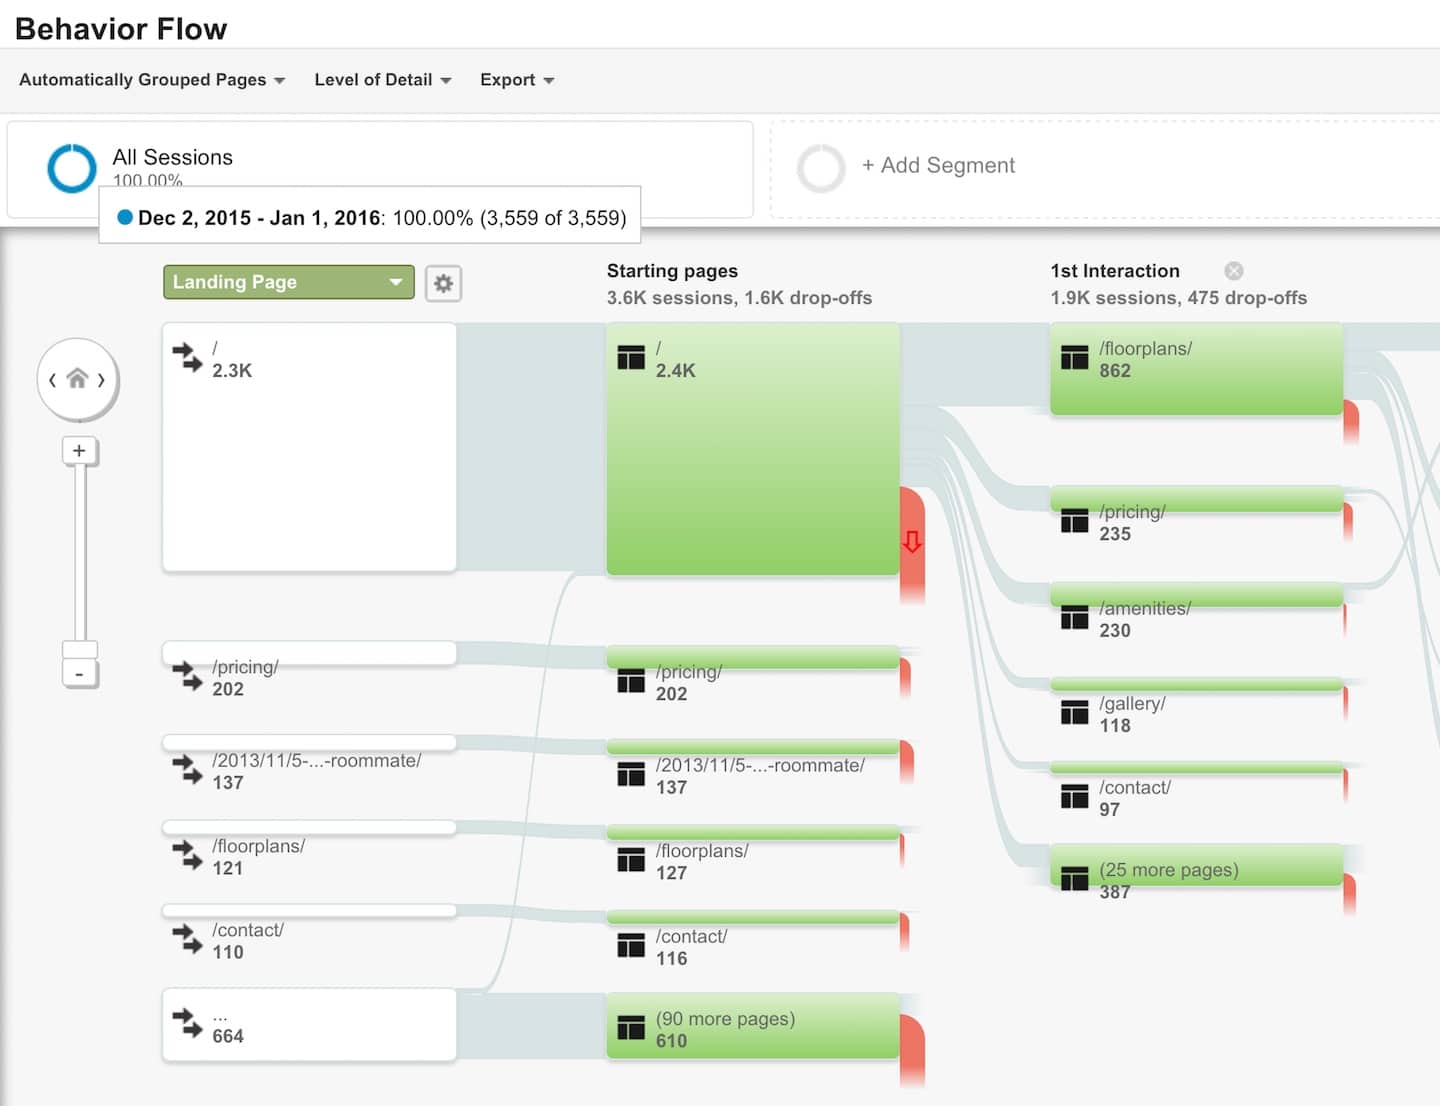
Behavior Flow: Understand Where Visitors Go
This one isn’t a metric, per se … but it’s still important to understand how visitors move through your website. How do they enter the site? Where they typically navigate first? Which pages most often lead to conversions? Does the flow vary depending on the traffic source? All of these can be answered by looking at the behaviors visitors are taking on your site, using the Behavior Flow report (Behavior > Behavior Flow).
Combined with the Bounce Rate metric, the Behavior Flow will help you see how visitors navigate your site, where they get stuck, and the specific pages where you should focus on making improvements to your design, content or calls-to-action.
Measure Campaigns with Custom Tracking Links
This one is a bonus tip. Whenever you run a campaign — be it an ILS, AdWords, an email drip, or some ads on social media — you want to understand how that campaign is performing for you.
This is where the Google URL Builder comes in handy. The URL Builder allows you to take any link to your website, and add custom tags that help you differentiate which campaign generated that traffic.
Google Analytics automatically reads those tags (called parameters) and uses them to build reports for each campaign (Acquisition > Campaigns > All Campaigns). You’ll easily be able to see how each campaign is driving traffic and leads to your site.
For example, let’s say the 30 Lines team wants to see if our Facebook ads are driving traffic to our landing page for our Top Line Local listings product. Instead of sharing the direct link (30lines.com/local), we might use the URL Builder to create a link like this:
http://30lines.com/local/?utm_source=facebook.com&utm_medium=cpc&utm_campaign=Local%20Dark%20Posts
Google Analytics automatically knows how to read that link, and would properly record any clicks as follows:
Source: facebook.com
Medium: cpc (so we know it came from one of our ads, rather than an organic share)
Campaign: Local Dark Posts (so we know which ads drove the click)
For quick access to the URL Builder, try installing this Chrome extension to help you build tracking links from any webpage you’re viewing in your browser.
To recap, one of the best ways to reduce your ad spend is to increase the conversions from your existing traffic. You’ll want to start by focusing on these metrics:
- Conversion Rate
- Overall Traffic by Source
- Bounce Rate on key sales pages, and
- Behavior Flow
With these metrics and tools in place, you’ll be doing a lot to help yourself get more out of the traffic you’re already getting.
This is by no means an exhaustive list of data points to track, but these ones will give you a solid foundation for more effective marketing and lead generation efforts, informed by real data and results. You’ve invested a lot in building a beautiful website; take the extra step to make sure it’s doing its job and converting as many leads as possible for you.
Your turn: What are you doing to measure the success of your website? What are the key metrics and indicators you watch?
Need some help setting up your conversion tracking on your site? Get in touch … we’d love to help!
BONUS: FREE Conversion Dashboard
Want an easy way to track your website conversions? We did the work for you.
You get a link to a custom Analytics Dashboard. Just open the link in your Google Analytics account for your website; all of the reports will automatically be applied to your custom data. It doesn’t get any easier!